
Article CategoriesAFM Magazine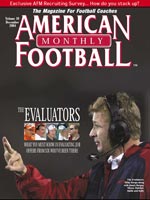
|
Recruiting: More of an art than a scienceby: AFM Editorial Staff© More from this issue While football recruiting over the years has become more scientific and sophisticated, the bottom line is that it is still an art in making a decision on a high school senior. No matter what the overall assessment concludes and no matter how many interviews are completed, there is no sure fire way of knowing if a player will perform up to both his abilities and/or the recruiters expectations. Like many things in life when a decision has to be made, there is a certain amount of risk. American Football Monthly just completed its first annual recruiting survey a detailed questionnaire that was sent to over 800 colleges at all levels Division I-A, Division I-AA, Division II, Division III, NAIA, and Junior Colleges. Sponsored by Recruiting Pro Software (www.RecruitingProSoftware.com), the questions ranged from the various forms of communication used to contact recruits to how recruits are evaluated. Similarly, relationship questions were part of the survey as well who is the ultimate decision maker when a student-athlete is making his college commitment. While, as you can imagine, budgets, institution size, and NCAA regulations all were factors that helped shape the results of the survey, two conclusions stood out when evaluating the overall results: 1 - the factors that helped determine the evaluation of a recruit at every level were clearly his performance on game tape as well as academic performance; 2 - while many are involved in the overall decision process as to where a recruit will ultimately commit, the bottom line choice is clearly his to make. More specifically, recruiting coordinators (or their representative) were asked to rank the factors that help determine the overall evaluation of a recruit. Those included academic performance in school, SAT/ACT scores, weight room performance, 40-yard dash time, game tape performance, physical characteristics, a recruit's potential, and intangibles. The overwhelming result was that at all levels while all the other listed factors go into a final evaluation-the most important was that of a players performance on game tape slightly outweighing academic record. Similarly, those contributing to a recruit's decision on a commitment generally include his parents and/or guardian and his high school coach. At all levels of competition, the recruit clearly is the ultimate decision maker followed by his parents and/or guardians, and then the high school coach. Other survey trends seem to indicate that while annual recruiting budgets are dependent on both the size of the school and level of competition, many institutions have a Recruiting Coordinator that doubles as a position coach, and that more and more schools at all levels-are communicating with recruits in a myriad of ways. What follows are the overall results: 1. Does your program offer full and/or partial athletic scholarships? A. Yes- we offer full athletic scholarships: Division I-A: 92.3%; I-AA: 50%; II: 46%; III: 0%; NAIA: 0%; JC: 14% B. Yes- we offer partial athletic scholarships: Division I-A: 0%; I-AA: 28%; II: 38%; III: 4%; NAIA: 100%; JC: 43% C. No- we do not offer full or partial athletic scholarships: Division I-A: 8%; I-AA: 22%; II: 16%; III: 96%; NAIA: 0%; JC: 43% 2. What forms of communication do you use in contacting recruits? A. Phone, E. mail, form letter, and handwritten note: Division I-A: 100%; I-AA: 89%; II: 92%; III: 94%; NAIA: 87%; JC: 64% B. Other forms of communication also used: fax, instant messaging, and/or video conferencing: Division I-A: 69%; I-AA: 56%; II: 38%; III: 29%; NAIA: 20%; JC: 46% 3. As a coach do you recruit by position or region or both? A. By position: Div I-A: 0%; Div I-AA: 0%; II: 0%; III: 0%; NAIA: 1%: JC: 18% B. By region: Div I-A: 31%; Div I-AA: 61%; II: 46%; III: 37%; NAIA: 40%; JC: 27% C. Both: Div I-A: 69%; Div I-AA: 39%; II: 54%: III: 63%; NAIA: 59%; JC: 55% 4. What is your overall recruiting budget annually? (Average per category) A. Division I-A: $250,000+ (46%); $100,000-$250,000 (46%); $80,000-$90,000 (8%) B. Division I-AA: $250,000+ (6%); $100,000-$250,000 (6%); $90,000-$100,000 (12%); $70,000-$80,000 (6%); $40,000-$50,000 (12%); $20,000-$30,000 (19%); $10,000-$20,000 (19%); $5,000-$10,000 (12%): $1,000-$5000 (8%) C. Division II: $20,000-$30,000 (36%); $10,000-$20,000 (27%); $5,000-$10,000 (18%) $1,000-$5,000 (19%) D. Division III: $100,000-$250,000 (1%); $40,000-$50,000 (1%); $20,000-$30,000 (9%); $10,000-$20,000 (24%); $5,000-$10,000 (21%); $1,000-$5,000 (44%) E. NAIA: $10,000-$20,000 (14%); $5,000-$10,000 (36%); $1,000-$5,000 (28%); under $1,000 (22%) F. Junior College: $30,000-$40,000 (1%); $20,000-$30,000 (18%); $10,000-$20,000 (17%); $5,000-$10,000 (19%); $1,000-$5,000 (18%); under $1,000 (27%)
E. NAIA: 4000-5000 (6%); 3000-4000 (6%); 2000-3000 (12%); 1000-2000 (13%) 750-1000 (12%); 500-750 (7%); 250-500 (15%); 100-250 (20%); 1-100 (9%) F. Junior College: 7000+ (9%); 2000-3000 (9%); 1000-2000 (9%); 500-750 (9%); 100- B. Division I-AA: Full Time Assistant Coach (76%); Recruiting Coordinator (24%) |

 Digital Download - 304 Pages of Football Forms for the Winning Coach


|
| HOME |
MAGAZINE |
SUBSCRIBE | ONLINE COLUMNISTS | COACHING VIDEOS |
Copyright 2024, AmericanFootballMonthly.com
All Rights Reserved