
Article CategoriesAFM Magazine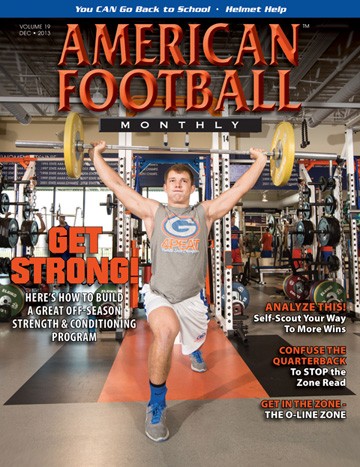
|
Self Analysis: Self-Scout Your Offense for a More Effective Game Plan.by: Rich HargittQuarterbacks Coach and Passing Game Coordinator Nation Ford High School, Ft. Mill (SC) © More from this issue The game has changed a great deal over the past decade. It used to be that offensive coordinators could create down and distance charts and run plays off of them with a pretty reliable sense of what would work. However, as the spread, no-huddle era has exploded onto the scene, it has transformed how coaches must approach the game. Our approach is to use statistics, specifically our offenses own statistics, to formulate a game plan. The majority of our game planning time is spent reviewing what our offense does well or what situations it most often finds itself in and not thinking about what the defense is doing. Defenses are unpredictable and there is no real way of knowing how they will approach a game. Our feeling is that it is more helpful to review our own offensive tendencies and positions in order to formulate what sort of attack might work. The charts included here show the basic structures that we use to look into our offense for an effective self-scouting system. They allow us to see if we are calling plays that give us the best possibility of success. We are an air raid team and so these work well for us considering our system. Regardless of the offensive system you employ, it is critical that your offensive coordinator take time to review key aspects of his play calling in order to find hidden tendencies. I have often reviewed these charts and found plays that should be called more often simply because they work. Analysis of our offense really led us to realize that we were not always focusing on the correct indicators of success. For instance, we had always made play sheets with the third down call in mind. A quick look at our season reflected that we spent very little time in third down situations. We are a pass-heavy team and scored very quickly more often than not. We realized that not much practice time should be devoted to third down plays. Had we not self-scouted, we would not have been practicing as effectively. We break the field into zones to see where we are attacking the defense with our passes. We realized that explosive plays - plays that gain 10 yards or more were really the key to scoring those points. Last fall, we had 126 plays that gained 10 yards or more and those plays generated over 2,000 yards of total offense. The risks of a few no-gain plays are far outweighed by the fact that the offense produced over 2,000 yards in only 126 snaps on offense. This kind of risk/reward is not only acceptable but it is part of the overall strategy of a good air raid offense. Therefore, we spent a lot of time figuring out which plays resulted in big gains and called those plays as frequently as possible. We also noted that we did a pretty good job balancing where these plays were being created thanks to a review of the field zone charts. Self-scouting is really the key component to gameplanning each week. After all, I can only control what I call and not what the defense is actually doing. It is important that the self-scout only takes into consideration things that will affect your team and your play calling. For instance, I havent provided a chart on completion percentages because we do not place a great deal of emphasis on that in our game plan. We focus on scoring points through the use of explosive plays and so several of these charts focus on how and where we can create those types of plays. These charts are a sampling of the things we look at when we gameplan our offense each week. We obviously look at what defenses our opponents run and their basic fronts, stunts, and coverages. However, all those things can change and I cannot affect them. These categories let me analyze what situations I am actually in from one week to the next and what works in each situation. Here are a number of charts that we use as a self-scouting tool for gameplanning our offense:
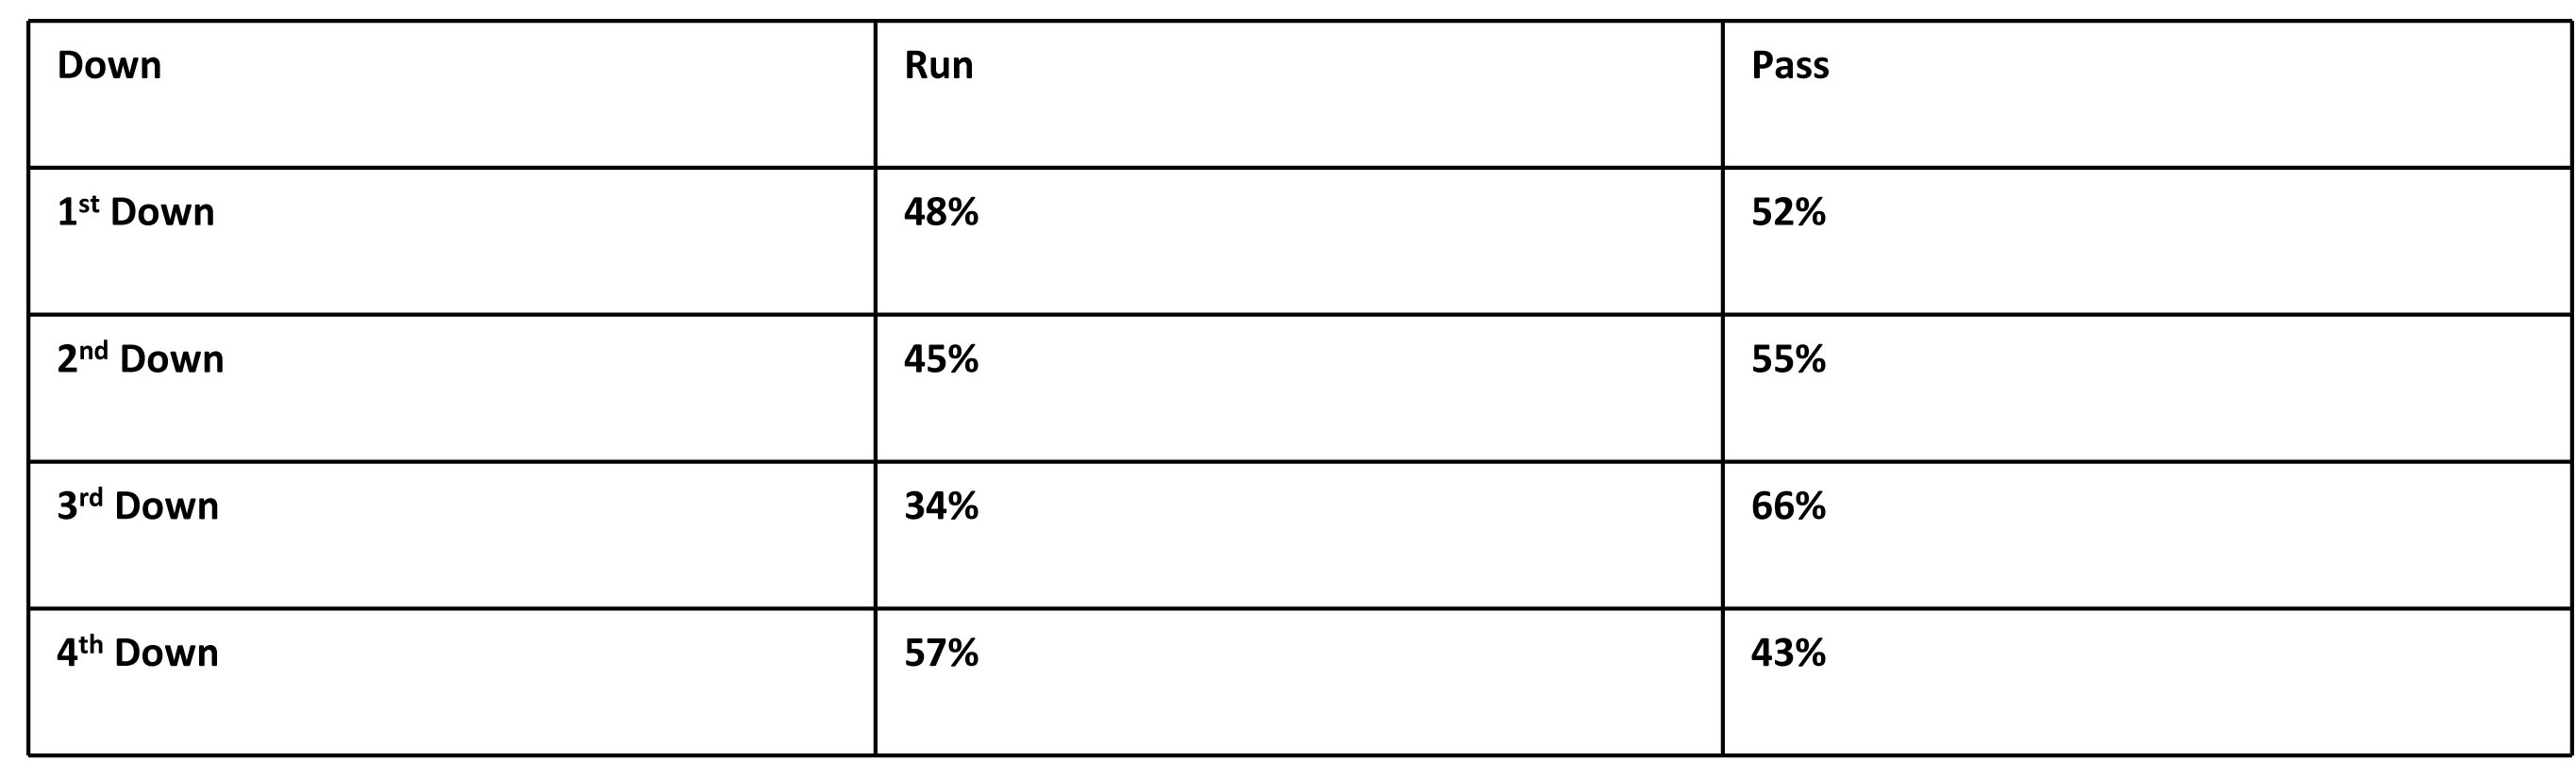
Chart 3 Play Calling by Downs This shows the breakdown of how often running and pass plays were used by down.
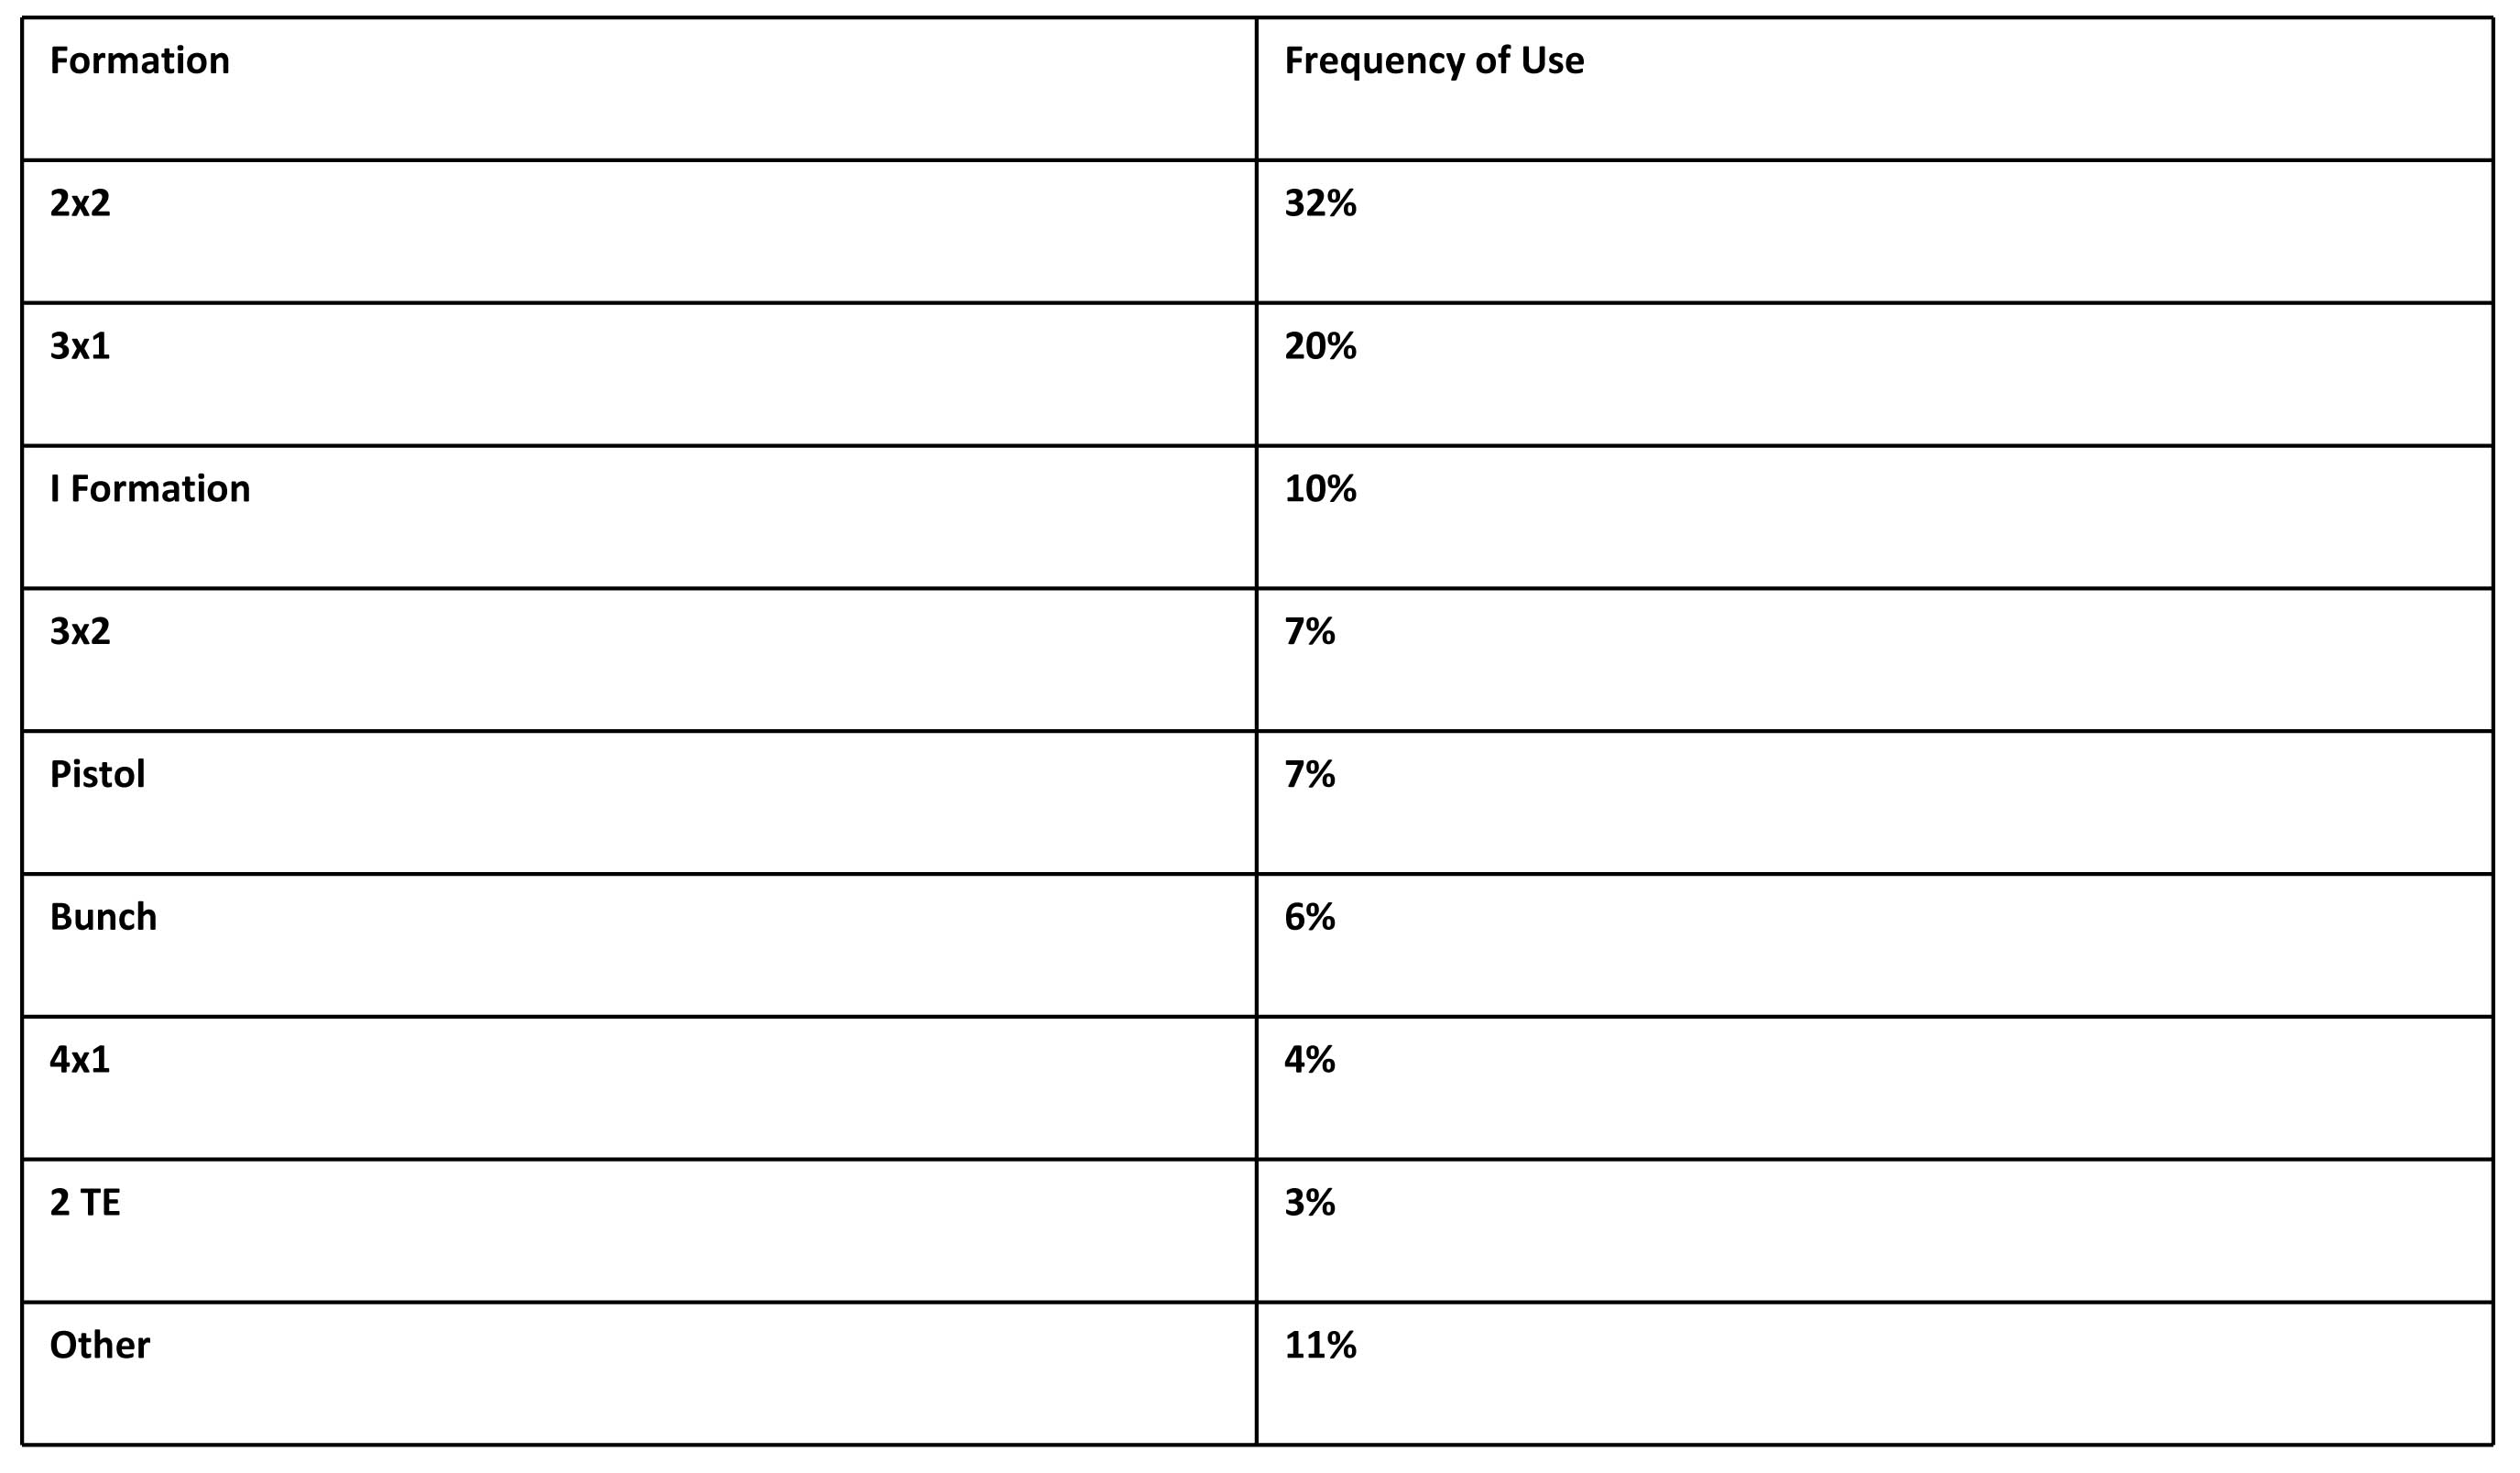
Chart 4 Formations This shows the frequency of each formation used during the season.
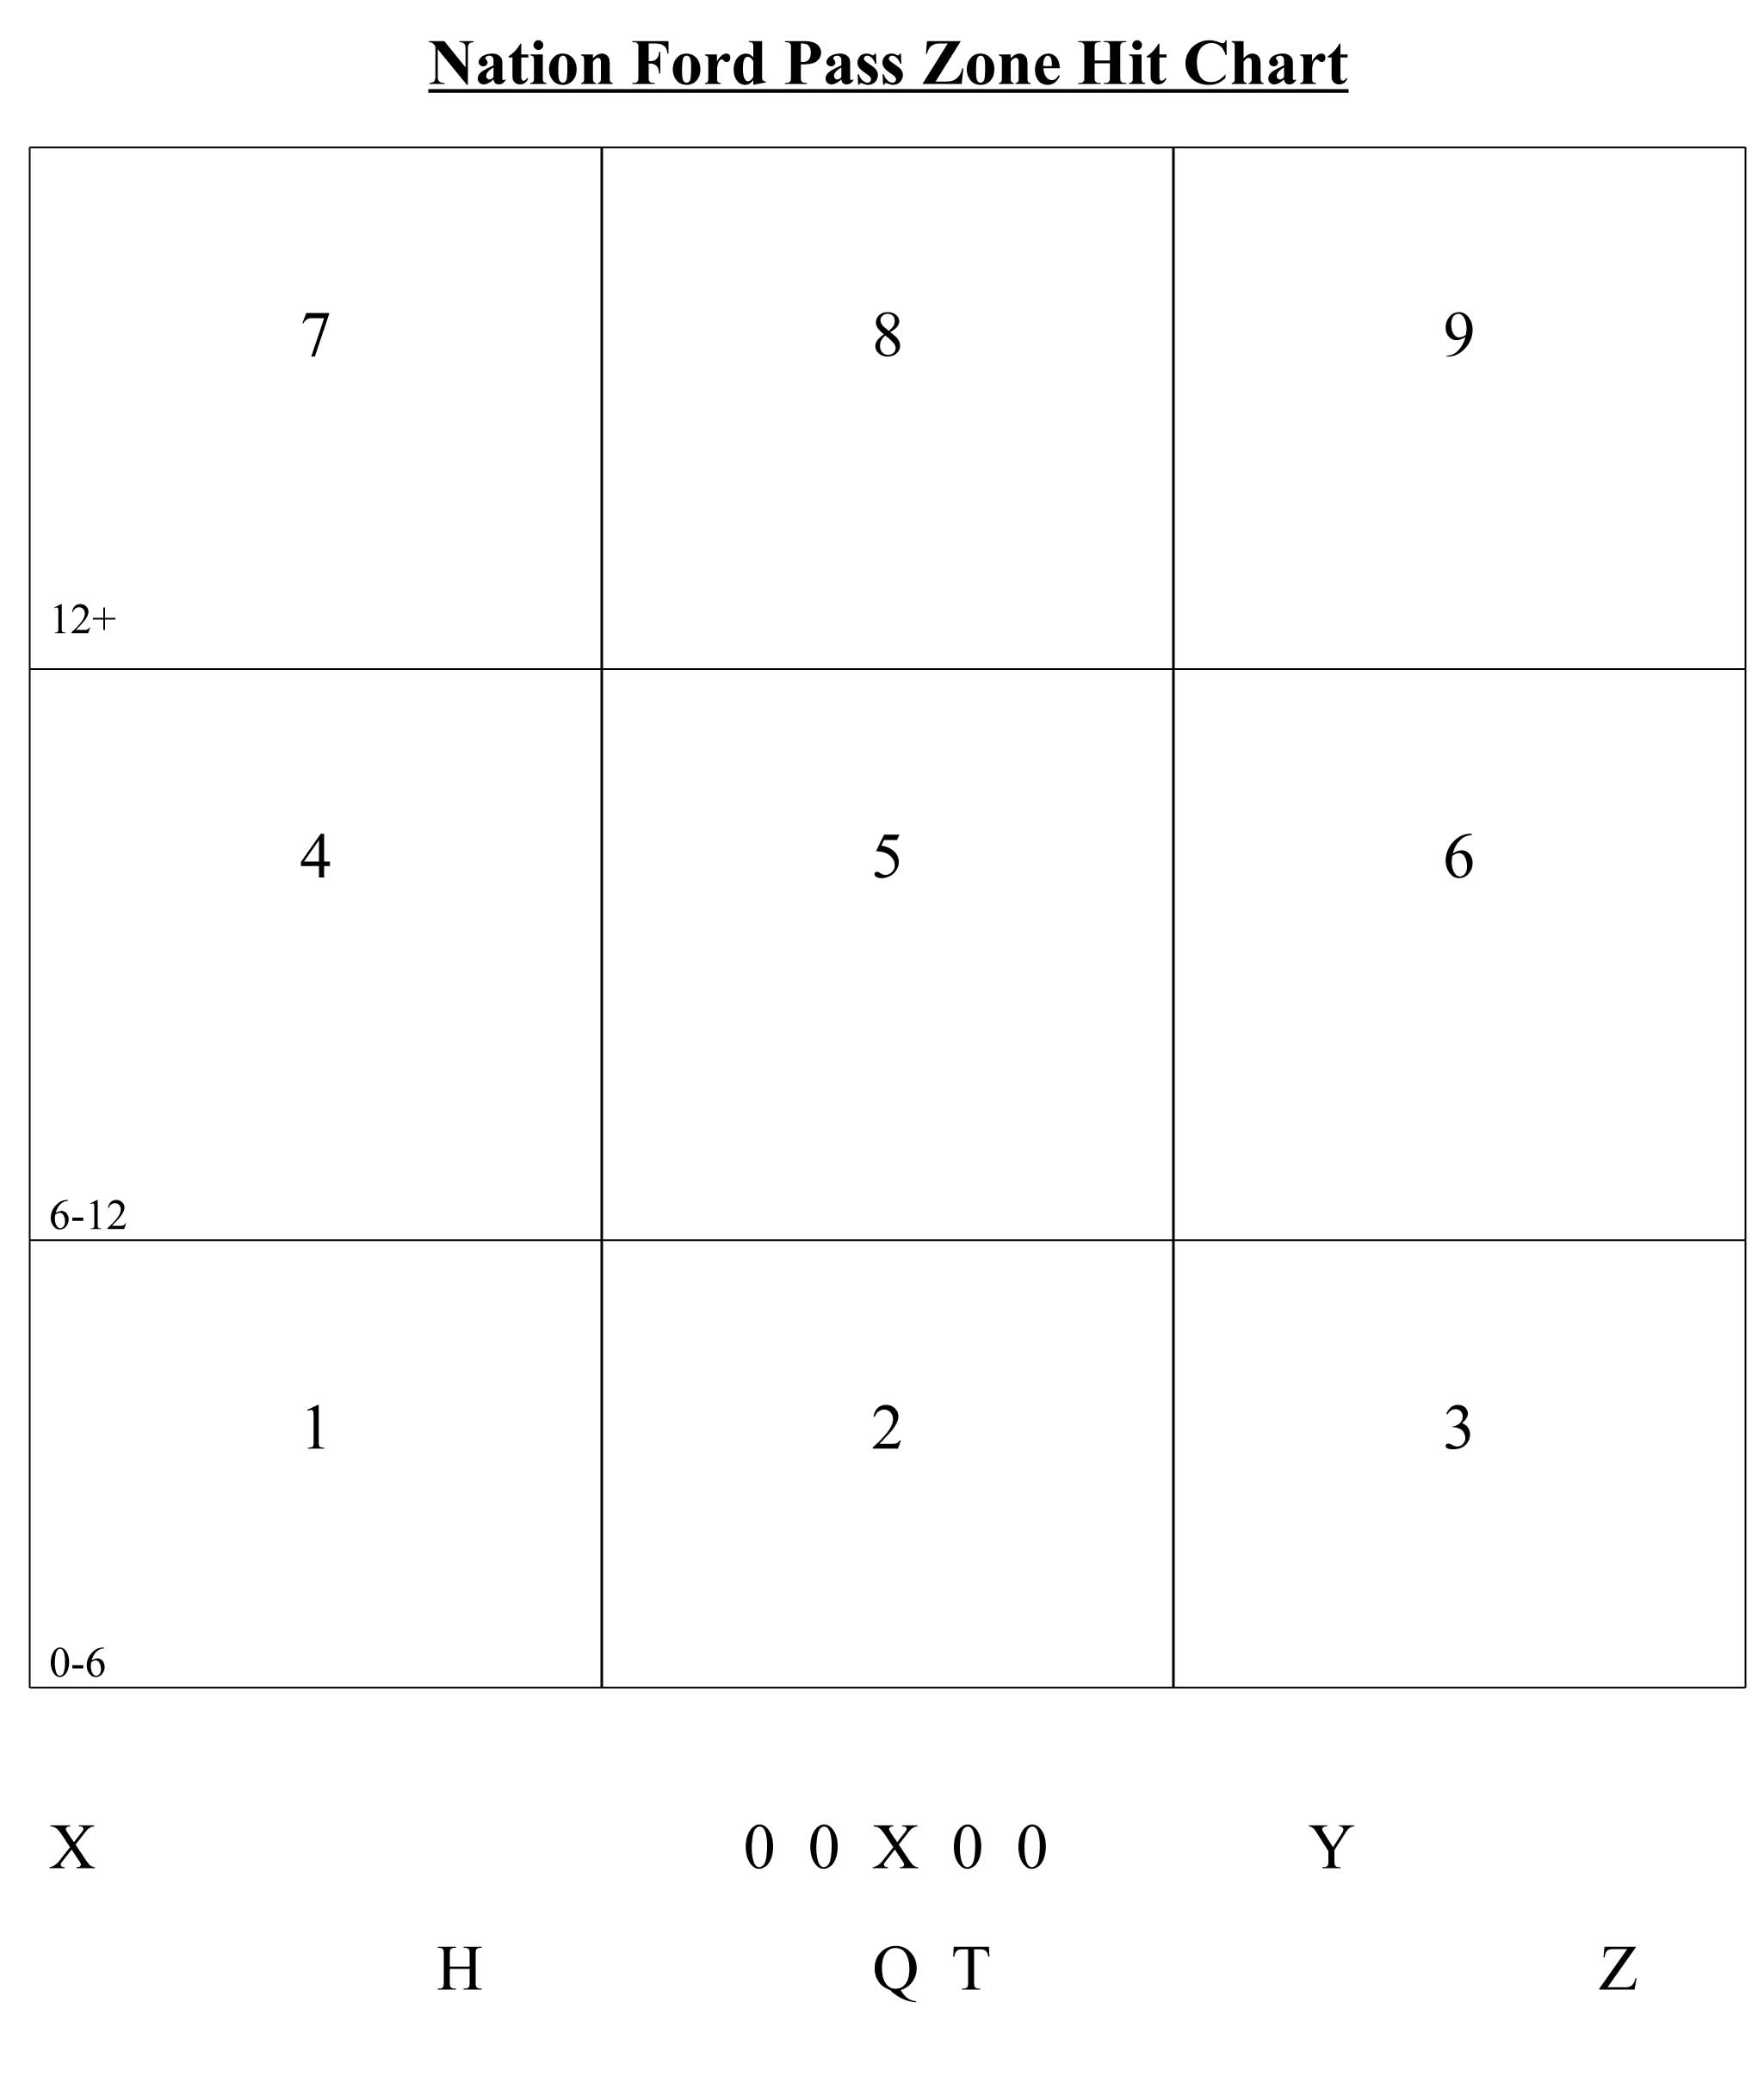
Chart 5 Passing Attack Chart by Field Zone This chart breaks down the nine passing zones and the percentage of passes thrown to each zone.
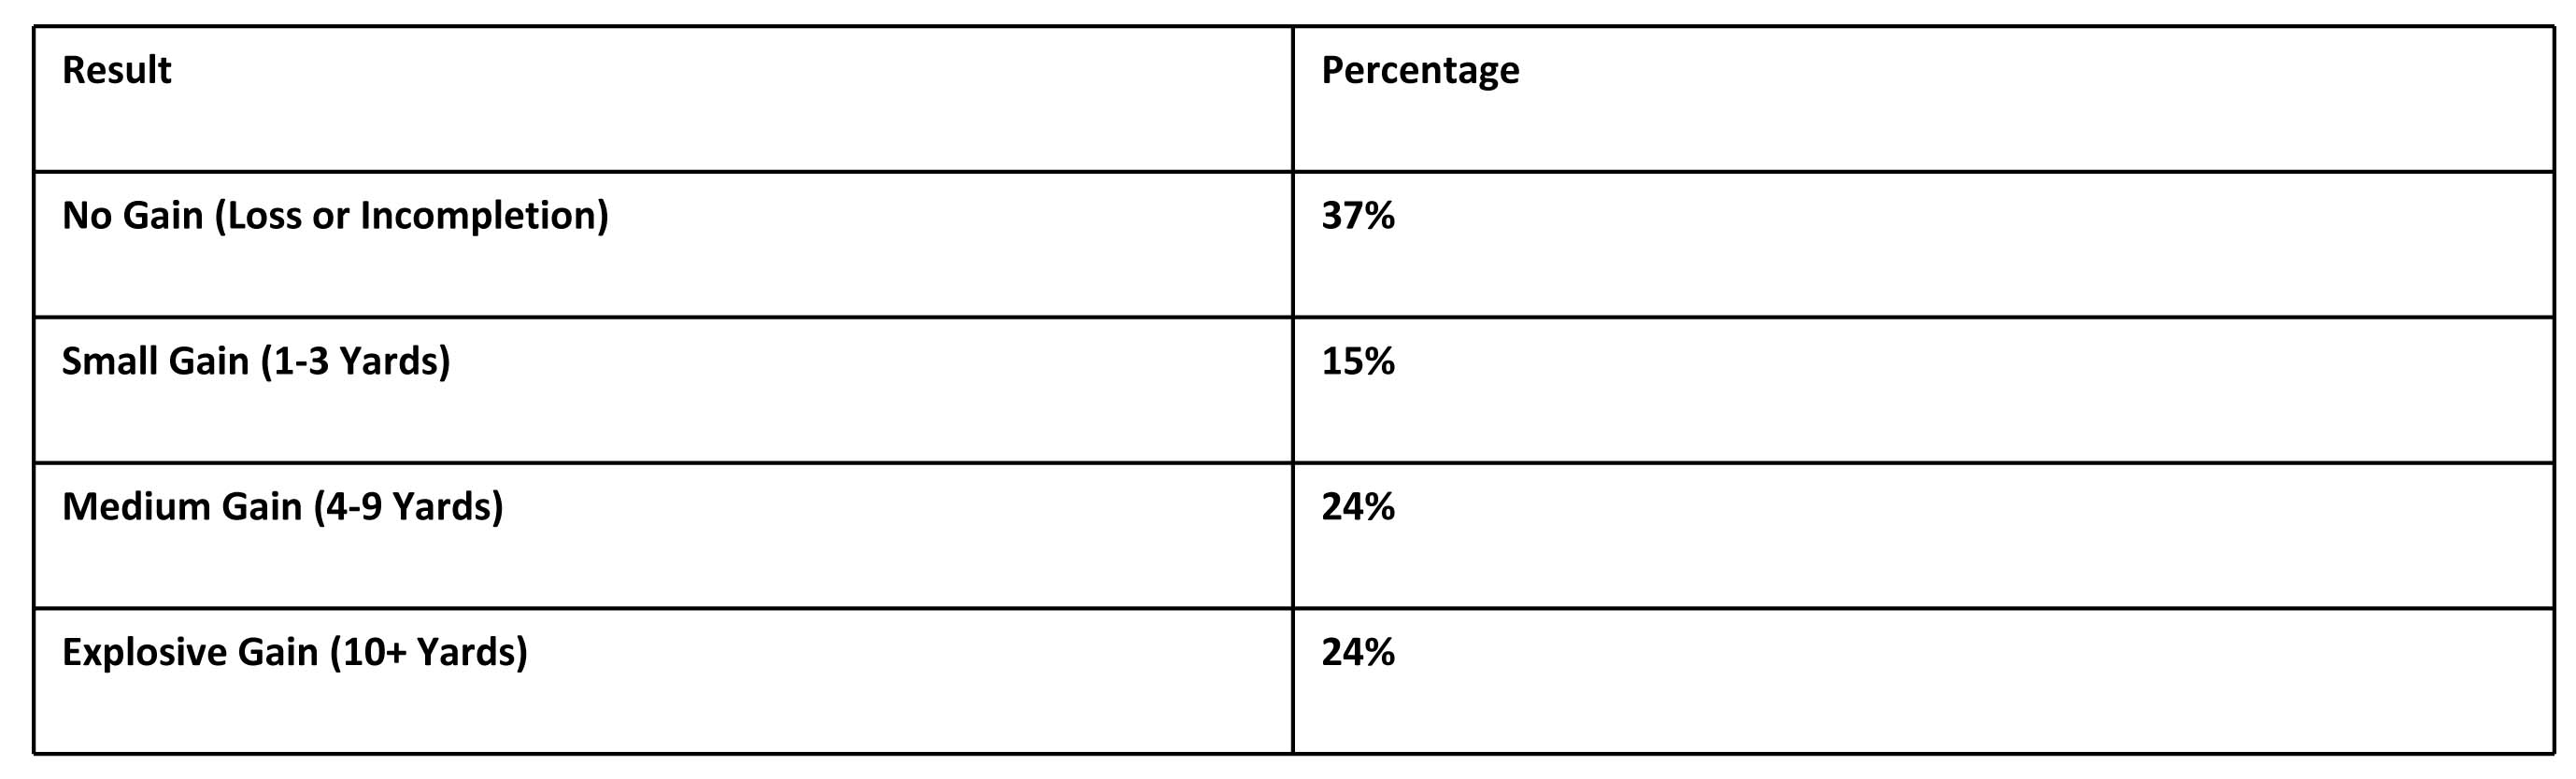
Chart 6 Results of Plays This chart shows the success rate of all plays called in 2012.
Chart 7 Plays Resulting in Explosive Yardage This chart indicates plays that resulted in explosive yardage. The plays include: TTZ Comeback a comeback route to the outside receiver
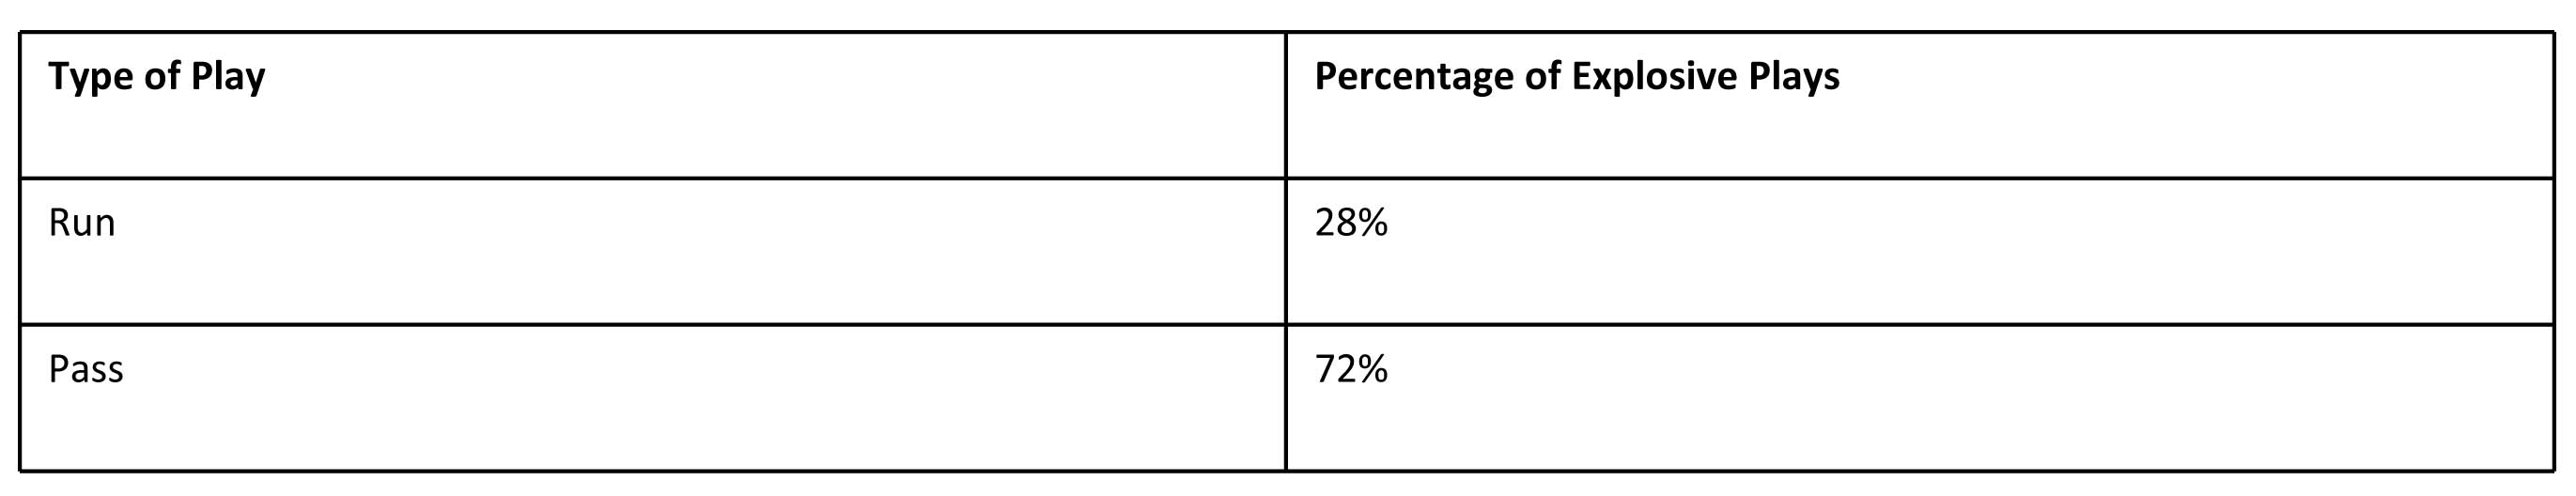
Chart 8 Explosive Play Calls This chart shows the percentage of explosive plays 10 yards or more by run and pass.
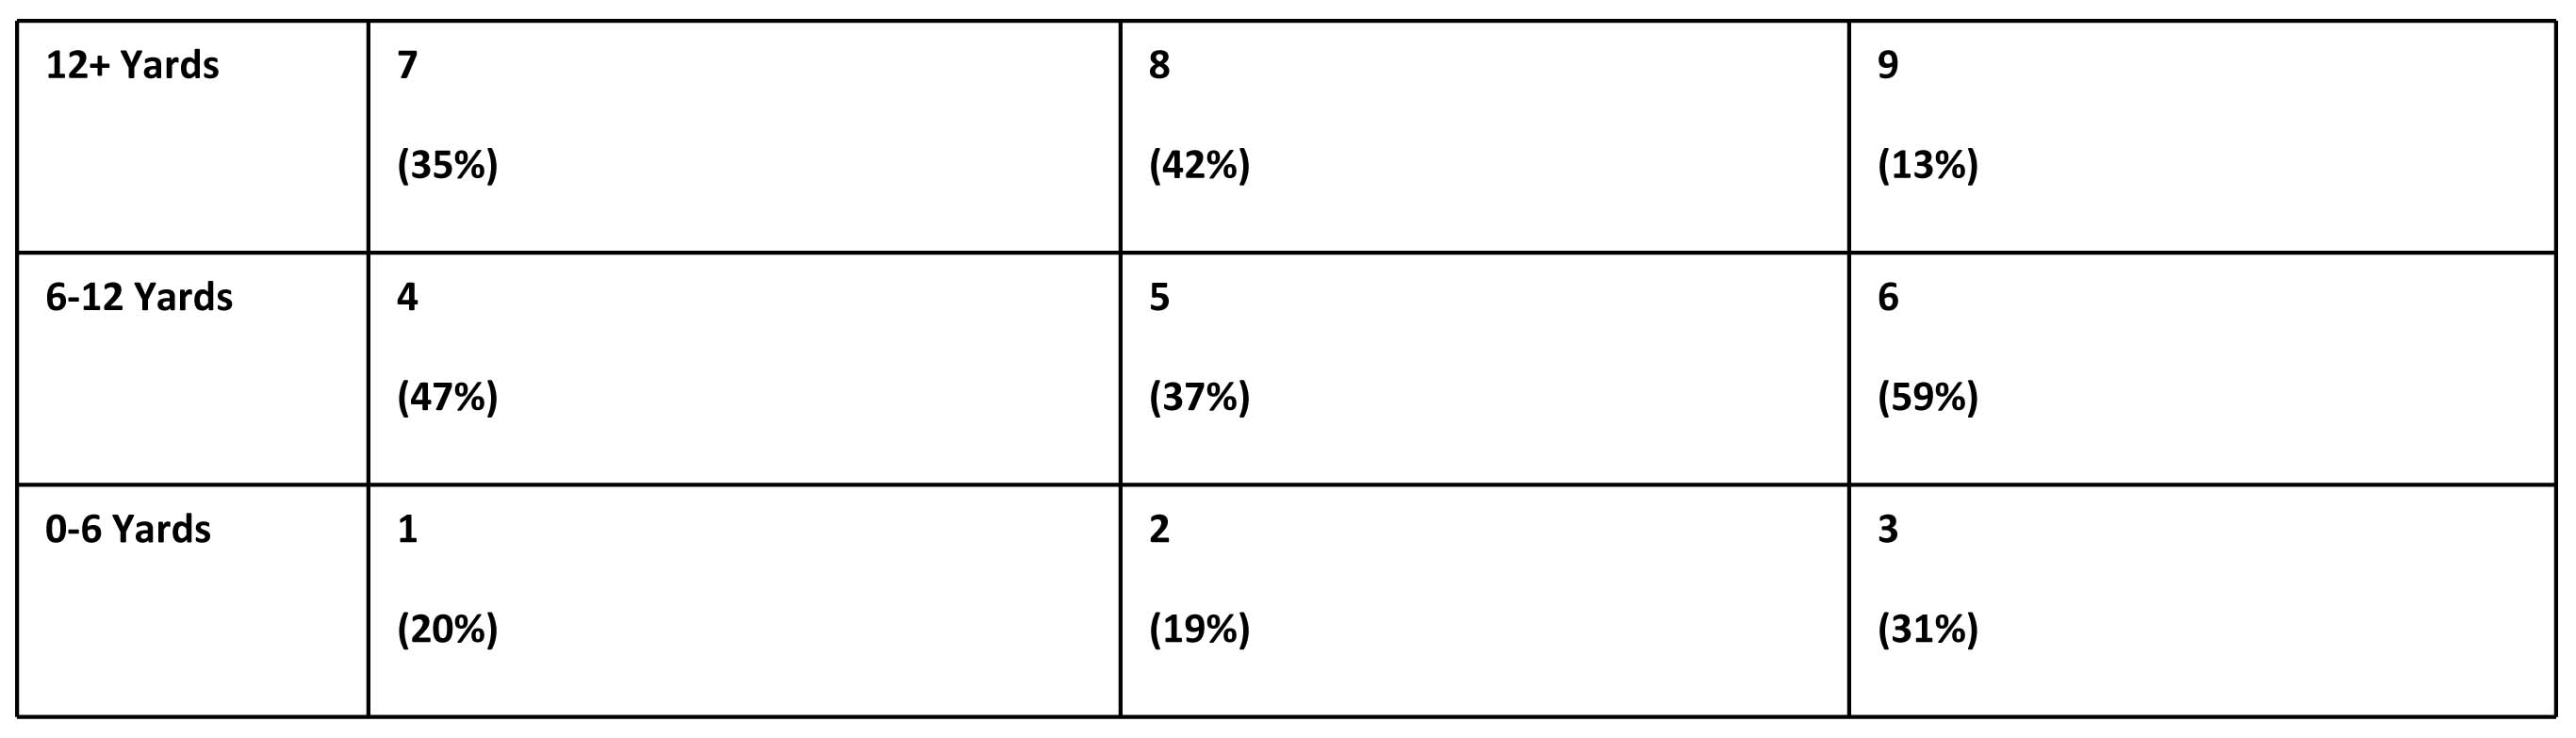
Chart 9 Explosive Plays by Pass Zone This chart shows explosive plays - 10 yards or more - in each of the nine pass zones. |
 Digital Download - 304 Pages of Football Forms for the Winning Coach

|

| HOME |
MAGAZINE |
SUBSCRIBE | ONLINE COLUMNISTS | COACHING VIDEOS |
Copyright 2024, AmericanFootballMonthly.com
All Rights Reserved