AFM RSS Feed Follow Us on Twitter       
AMERICAN FOOTBALL MONTHLY THE #1 RESOURCE FOR FOOTBALL COACHES
ABOUT |  CONTACT |  ADVERTISE |  HELP  


   User Name    Password 
      Password Help


Article Categories


AFM Magazine

AFM Magazine


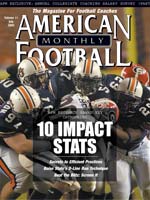
10 Impact Stats to Build a Championship Team

AFM has researched and ranked the top statistical categories that you must excel in on the field to win a championship.
by: W. Keith Roerdink
© More from this issue

Click for Printer Friendly Version          

There are lies and myths in the game of football. There are tried-and-trues that coaches cling to. But one thing is for sure: Statistics don’t lie. American Football Monthly examined every statistical category among the top ten teams in NCAA Division I-A football over the past five years in search of the numbers that define success among the best of the best. But moreover, these are numbers that define success at every level of the game: Pro, Div. I-A, Div. I-AA, Div. II, Div. III, NAIA, Junior College and High School. By charting the teams’ ranking in each category, we were able to come up with a five year total. The lower the overall number, the greater impact that category had on winning.

As it turns out, the old adage that ‘defense wins ball games’ is a pretty true statement. Out of the 20 statistical categories compiled by the NCAA that were common over the last five seasons, defense dominated with five of the top six overall rankings, led by Scoring Defense. Stop your opponent from putting up points, and you’re going to win a lot of games.

But it’s not so much a matter of being No. 1 in a particular category, even a key one, that equates to success. North Carolina State was tops in Total Defense last season, but finished 5-6. Instead, it’s ranking high in the right combination of categories that results in the ‘W’s.’ USC was 6th in Scoring Offense and 3rd in Scoring Defense and Passes Intercepted, went 13-0 and won the National Championship. They had four No. 1 rankings overall, out of 20. Penn State was 5th in Scoring Defense in 2004 and tied for 17th in Passes Intercepted. But their 109th ranking in Scoring Offense had a lot to do with their 4-7 record.

Two coaches of the year, Tommy Tuberville of Auburn, whose Tiger’s went 13-0 and finished second in the nation and Todd Dodge of Southlake Carroll (Texas) High School, whose teams have gone 47-1 over the past three seasons and collected consecutive state championships, offered up their input on the list, relating it their own teams’ success. Here’s a breakdown of the top ten statistical factors that determine success on the gridiron.

#1. SCORING DEFENSE


When they talk about the best offense being a good defense, what they’re really saying is that if you keep the other team out of the end zone, you need not be as concerned with how much you’re scoring. Teams that excel in this category are the teams at the top of the polls at seasons end. The last five National Champions ranked 3rd, 1st, 2nd, 1st and 7th in this category and at least half of the top ten teams over the past four seasons ranked in the top ten in Scoring Defense. The Auburn Tigers led the nation last year giving up a mere 11.3 point per game on average. Coach Tuberville, who also coached defense at the University of Miami from 1986-1993 and was part of three National Championships, wasn’t surprised at all that this statistic was the most important factor among winning teams.

“I know the years that we were at Miami when I was coaching defense we very seldom gave up over 100 points a year and when you do that, that means you’re getting the ball back for your offense,” Tuberville said. “That’s more possessions per game. And you might give up a few more yards but the points are what it’s all about when it comes down to it. That’s what we try to win every year. We try to give up as few points as we possibly can.

“If you can keep it somewhere below 15 points per game, you should have a successful year and that should get you somewhere in the top ten.”

#2. RUSHING DEFENSE

Running the ball, as it turns out, is ranked 15th in the listing, so say the statistics. Stopping the run isn’t. Make the other team one-dimensional and you’re halfway to victory. The last three National Champions; USC, LSU and Ohio State, ranked no lower than 3rd in this category. Though Miami ranked a mediocre 40th against the run in 2001, their rankings of 1st in Scoring Defense and 3rd in Scoring Offense more than offset the low mark. In 2000, Oklahoma ranked 23rd. The top teams in Rushing Defense when the Hurricanes and Sooners hoisted up the hardware? UAB and Memphis. So it’s safe to say that while important, it’s no guarantee to a successful season on its own.

“On defense you have to be able to stop the run, not give up the big play and cause turnovers. That’s the three things that we try to do.” said Tuberville, whose Tigers were 12th best in the country stopping opposing runners.

#3. SCORING OFFENSE

The category you thought might be No. 1 still rates high at No. 3. When you’ve got more firepower, good things are going to happen. But this is a category that becomes even more meaningful when a team combines this with a high ranking in key defensive categories. In 2002, Ohio State ranked 41st in Scoring Offense but still won it all. The year before, Miami ranked 1st in Scoring Offense and Scoring Defense and won it all. But few offenses have put up points in recent years like Boise State. They ranked 2nd in 2004 averaging 48.92 points per game. They led the nation in 2003, 2002 and 2000. Their rank in the year end coaches poll the last three seasons were 13th, 15th and 12th.

In the high school ranks, Dodge’s Dragon’s put up almost as many points as Boise State. Led by quarterback Chase Daniel, the Texas State Player of the Year, Southlake Carroll High put up 46 points per game. Over a three year span, Dragon quarterbacks have thrown 151 touchdown passes in their high octane, no-huddle offense.

“We averaged about 580 yards a game last year, but bottom line is that it doesn’t matter how you get it in the paint so to speak, as long as you get it in the paint,” Dodge said. “And it doesn’t matter if it’s rushing or passing. The last two years, being in a one-back offense and shotgun, our quarterback and our running back have averaged over 1,500 yards rushing and the quarterback was over 4,000 yards passing.”

#4. TOTAL DEFENSE

Only one National Champion (LSU in 2003) ranked No. 1 overall in this category. Perhaps the bigger surprise is that when Oregon was the second best team in the country in 2001, they ranked 81st and were 110th in Passing Defense. The Ducks 81st ranking in Total Defense was the lowest ranking by any top ten team over the past five years, but there are exceptions to every rule, or in this case, statistic. TCU led in Total Defense twice in the past five years (2000 and 2002), but last seasons’ leader, North Carolina State, gave up the fewest yards per game over that timeframe, just 221.36. Tuberville’s Tigers placed 5th in Total Defense, giving up 277.62 yards per game, but surrendering just 19 total touchdowns, the second lowest total given up in 2004.

“If you look at most of the coaches now across the country that have been successful, myself, Nick Saban, Pete Carroll, Bob Stoopes, all those guys are defensive guys and again, going back to my Miami days, everybody talked about how good we were offensively and how many points we scored, but it really didn’t make a lot of difference because we never gave up any points,” Tuberville said.

“When you’re good on defense it gives your offense a lot of chances to go for big plays, you’re going to give them more turnovers, you’re going to give them balls in better field position and to me, that’s where it really starts is defense. You can look at some teams that are averaging 40, 45, 50 points a game, but sooner or later someone’s going to stop you and you’ve got to be good on defense to win consistently. You can win games offensively, but to win consistently, to win the close games and to consistently stay in the top echelon, you’ve got to play consistent defense.”

#5. PASS EFFICIENCY DEFENSE

This category uses similar criteria to Pass Defense, 17th on our list of important factors, but it throws out yards per completion and average yards per game allowed and factors in touchdown percentage. What that means is that while it’s good to keep your opponents passing game in check, it’s even better to keep them out of the end zone. Top ten teams were most successful at this in 2003, when five of the top ten were in the single digit rankings in this category. LSU was second, Oklahoma was third, Miami was fourth and Washington State was fifth.

#6. PASSES INTERCEPTED

At the end of most games, you can look back on a handful of key plays that turned the game in your favor. Few plays are more meaningful than an interception. Only two top ten Division I-A teams over the past five seasons ranked 1st in Passes Intercepted (No. 5 Oklahoma in 2002 and National Champion Miami in 2001). Troy led the nation with 25 interceptions in 2004, followed by Boise State (23) and USC (22).

Fumbles bring an offense to the same screeching halt as a pick, but it’s what happens in the seconds that follow that matter most. Most players are taught to fall on a fumble. But with interceptions often occurring in space, they take on a whole different dimension.

“That interception for some reason, it just swings momentum a little bit more for some reason. Interceptions you can turn into an offensive weapon.” Dodge said.

As for Fumbles Recovered coming in 12 spots lower on our list, Dodge wasn’t quite sure what to make of it.

“The only thing I’d read into that is that in the age that we’re in with so many people throwing the ball, they can overcome fumbles a lot more than they used to. And maybe now not as many people are running the ball as much as they used to.”

#7. PASSING EFFICIENCY:

You can make a pretty convincing argument that the quarterback is the most important player on the field in most games, but you’ll notice this category isn’t Passing Offense. In fact, that’s much farther down the list. This category isn’t about yards per game or yards per completions, it’s about efficiency. That’s why touchdown percentage is factored into the formula for each teams’ rating. Last year saw the best pass efficiency in the past five seasons, with six of the top ten teams ranking in the single digits, led by Louisville at No. 1, with an 11-1 record and a 174.36 rating. This category combines pass attempts, completions, completion percentage, interceptions, yards, yards per attempts, touchdowns and touchdown percentage.

“We have a goal to average 21 completions per game and we’ve done it the last three years and that’s a big deal for us,” Dodge said. “And then the touchdown passes just skyrocketed so that says a lot to the efficiency of the passing and our quarterbacks.”

On the collegiate level, Auburn ranked second in the nation in Passing Efficiency. Led by quarterback Jason Campbell, the Tigers compiled a rating of 173.61.

#8. TOTAL OFFENSE

Rushing Offense and Passing Offense rank low at 15th and 16th, respectively, but total yardage can add up to total domination. With six of the top ten teams in the polls ranking in the top ten in Total Offense and nine of ten in the top 25 statistically, 2000 was the most offensive year in the past five, though last year Louisville and Utah finished 1st and 3rd . The glaring exception to this statistic is Idaho in 2001. They ranked sixth in the nation in Total Offense, racking up 464.82 yards per game. But their record was 1-10. How? Easy. Their ranking in Total Defense was 110 and they gave up 478.55 yards per game. Again, it’s the combination of high rankings in key categories that lead to victory and the ability to strike a balance on both sides of the ball.

“Our philosophy at Auburn is we play a football game and the relationship has to be very united, they have to work together,” Tuberville said. “You can’t just say, here’s the offense, you do your thing, defense you do your thing. I’ll tell our offensive coordinator, ‘listen, we’ve been out there for 12 plays, let’s grind some first downs, let’s not go for big plays... unless it’s there.’ But we work hand-in-hand to make sure our defense gets a breather and doesn’t go right back out there.”

#9. TURNOVERS GAINED

There’s a joke about a quarterback who opened up a bakery specializing in turnovers. But seriously, this is a category that can be a great equalizer, and it has more to do with interceptions (Passes Intercepted was the 6th most important statistical category) than fumbles (Fumbles Recovered came in at 18). Iowa was 101st in Total Offense, but they were 2nd in Turnovers Gained. For the Hawkeyes, this meant they were consistently stopping their opponents offense, even if they weren’t doing a lot with the ball once they got it. At least not on the ground, where they ranked 116th in Rushing Offense. But at the end of the season, those 32 Turnovers Gained had a lot to do with being No. 8 in the coaches poll.

“I think turnovers are a huge factor,” Dodge said. “If you turn the ball over, there’s a high percentage of times it equals a touchdown for the other team and that’s a point I always want to get across to our offensive players. We’re basically giving them a touchdown. And they may not get you now, but it will come back to haunt you.

“A goal of our defense is to force three turnovers a game. And I tell our offense that it doesn’t do our defense any good to force turnovers if we don’t score. So one of our goals is to score after a turnover. When the defense gets one, we need to go rev it up and put it in the end zone. And I think coaches across America preach that: turnovers, turnovers, turnovers.”

#10. TURNOVER MARGIN:


Tucked just behind Turnovers Gained and two ahead of Turnovers Lost, this category proves it’s better to receive than give when it comes to football. Over the past five seasons, 2001 champion Miami had the best Turnover Margin, with a 2.36 rating. They collected 18 fumbles and 27 interceptions, while losing just ten balls on the ground and nine through the air. USC has finished 1st, 2nd and 5th in Turnover Margin in the past three years, while finishing 1st, 2nd and 4th in the polls. Like any other category, a high ranking here doesn’t automatically translate to wins, but a pretty good team becomes nearly unbeatable when they do well here.


Next month AFM begins it’s 10-part series by breaking
down each of the top 10 statistical categories beginning
with Turnover Margin


NEW BOOK!

AFM Videos Streaming Memberships Now Available Digital Download - 304 Pages of Football Forms for the Winning Coach


HOME
MAGAZINE
SUBSCRIBE ONLINE COLUMNISTS COACHING VIDEOS


Copyright 2024, AmericanFootballMonthly.com
All Rights Reserved