AMERICAN FOOTBALL MONTHLY THE #1 RESOURCE FOR FOOTBALL COACHES

Article CategoriesAFM Magazine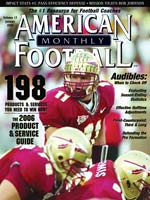
|
Crunching NumbersCollecting, evaluating, and using your end of the season statisticsby: Jeff Shutter Quarterbacks Coach, Franklin & Marshall College © More from this issue Now that the season is over and the dust has settled, it’s time to look back and evaluate your season. As offensive coaches, we all accumulate a huge amount of statistical data over the course of the season. We also know that statistics can be deceiving. Using all the data we collect can help us understand our own offense as well as determine those areas which need improvement. In this article I will discuss how to collect data, evaluate your statistics, and implement the necessary changes to improve your offensive production. Good offensive coaches keep a tracking sheet on game day to chart the plays being run. Over the years, I have had my third team quarterback stand next to me on the sideline and chart the plays. At half time we consult the play chart to reinforce what we believe is happening on the field. The chart help....The full article can only be seen by subscribers. Subscribe today!
|
 Digital Download - 304 Pages of Football Forms for the Winning Coach

|
|||||||

| HOME |
MAGAZINE |
SUBSCRIBE | ONLINE COLUMNISTS | COACHING VIDEOS |
Copyright 2026, AmericanFootballMonthly.com
All Rights Reserved